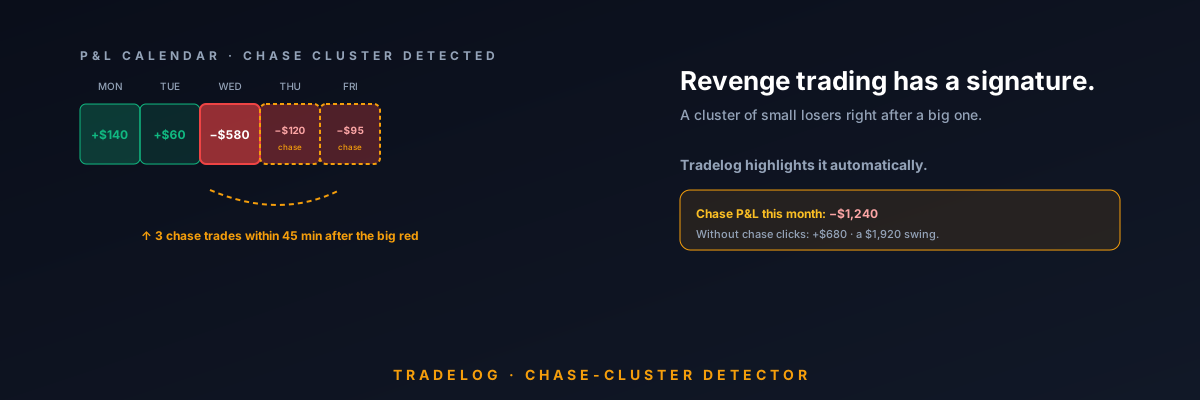
Stop revenge trading — the pattern Tradelog's calendar catches automatically
A three-panel visual you can steal to spot revenge trading in your own history — before it turns a red week into a red month.
Revenge trading has one signature: a cluster of small losers immediately after a large one. Tradelog's calendar auto-highlights this pattern in amber.
The rule of thumb: If the loss on any trade is > 2× your average loss for the month, the next three trades within 45 minutes are flagged as *chase trades* — and their aggregate P&L is shown separately in the day cell tooltip.
Most prop firm traders discover they lose 40-60% of their monthly P&L to fewer than 4% of their trades. Cutting them out doesn't require more analysis; it requires seeing them.
Inside Tradelog, hover any red day → *Behaviour* tab → the chase-cluster is highlighted with the counterfactual P&L (what the day would have been without the chases).